MATLAB在绘图区添加箭头标注
MATLAB在绘图区添加箭头标注
1 前言
采用MATLAB中的annotation函数对已有绘图添加注释,并且提供了一个非常方便调整位置参数的小技巧。
2 准备数据
随机生成一些数据,rng(100)为设置随机数种子为100,保证每次运行代码产生的随机数是一样的。
1 | %% 数据 |
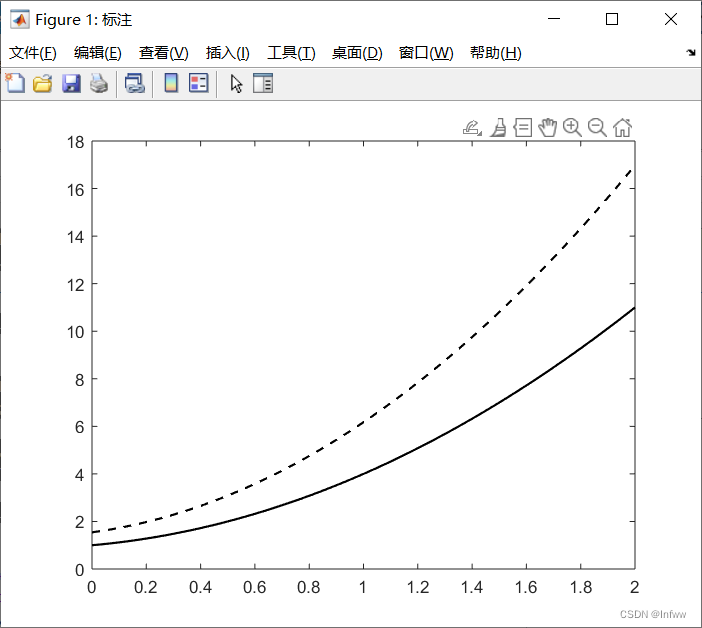
绘图
1 | f = figure('Name','标注'); |
3 添加注释
添加注释采用annotation函数:
annotation(lineType, x, y)创建一个在当前图窗中的两个点之间延伸的线条或箭头注释。将lineType指定为’line’、’arrow’、’doublearrow’或’textarrow’。将x和y分别指定为[x_begin x_end] 和 [y_begin y_end]形式的二元素向量。
| 值 | 对象类型 | 示例 |
|---|---|---|
| ‘line’ | 注释线条 | annotation(‘line’, [.1 .2], [.1 .2]) |
| ‘arrow’ | 注释箭头 | annotation(‘arrow’, [.1 .2], [.1 .2]) |
| ‘doublearrow’ | 注释双箭头 | annotation(‘doublearrow’, [.1 .2], [.1 .2]) |
| ‘textarrow’ | 注释文本箭头。要在文本箭头的末尾添加文本,请使用string属性。 | annotation(‘textarrow’, [.1 .2], [.1 .2], ‘string’, ‘my text’) |
这是最常用的是textarrow,下面重点介绍该类型。
4 textarrow
这是变量Str为注释的内容,[0.5,0.5],[0.5,0.5]和an.Position表示箭头两点的坐标以及位置,刚开始可以随便给,后续再进行调整。
1 | % 添加注释 |
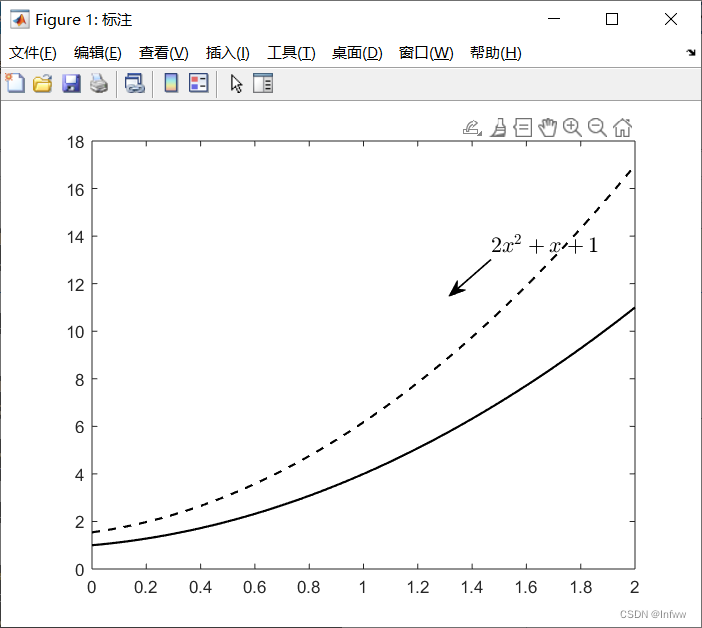
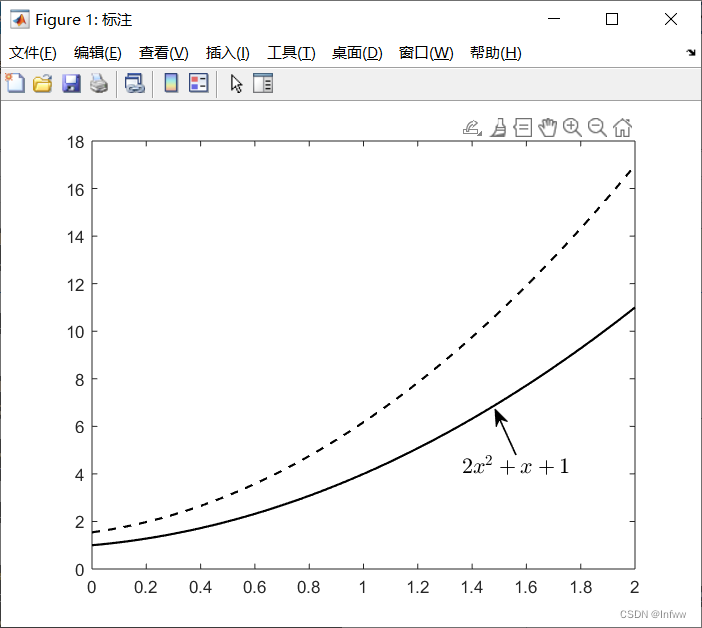
可以看到,上图中已经出现了注释,但是注释的位置不是自己想要的位置,下面来对注释的位置进行调整。
5 调整注释位置
点击这个“打开属性检查器”按钮后会弹出右边的属性对话框。
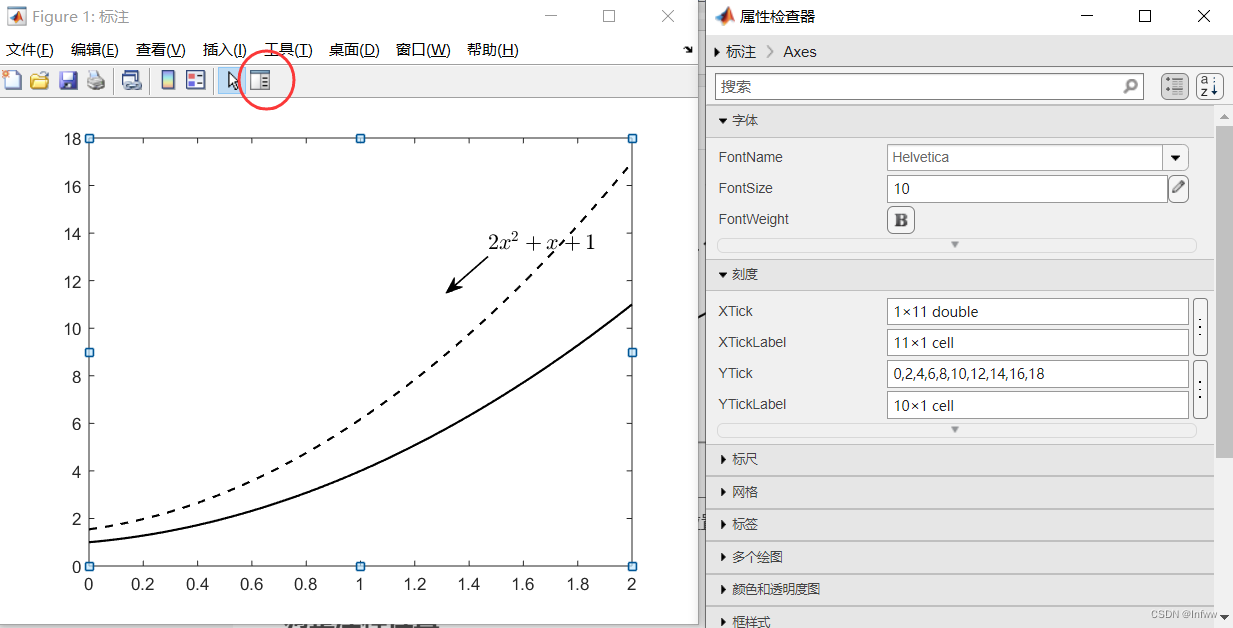
然后首先点击注释的箭头,然后在右边的属性对话框点击位置。
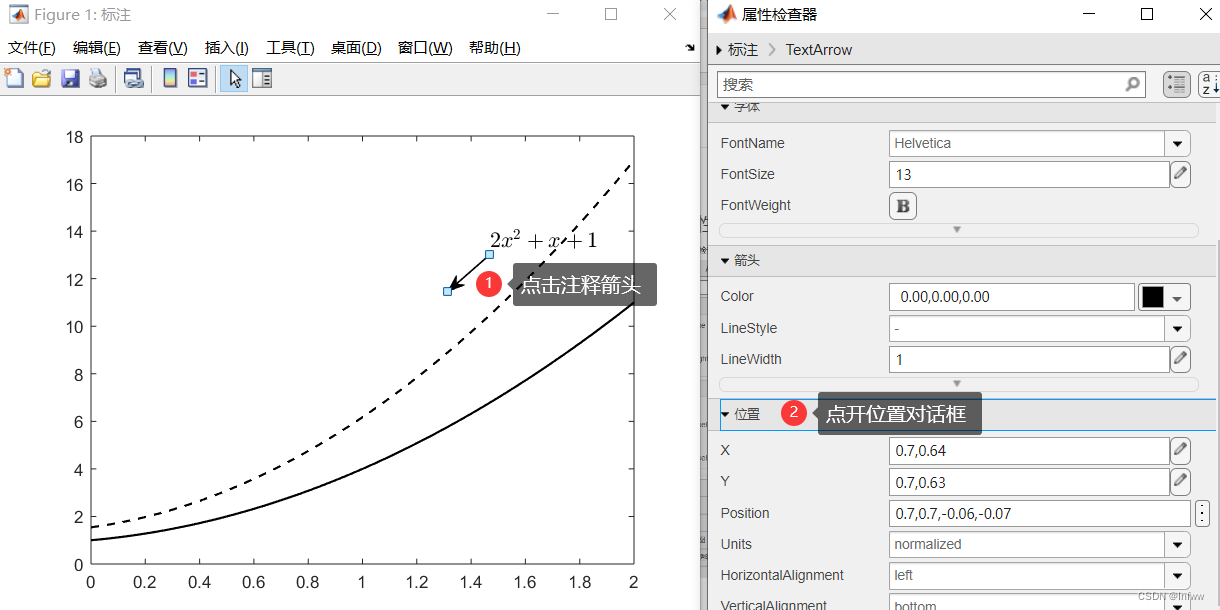
这个时候可以手动拖动注释箭头到合适的位置,查看属性对话框中的位置下的X、Y和Position,将值复制到对应数组中。
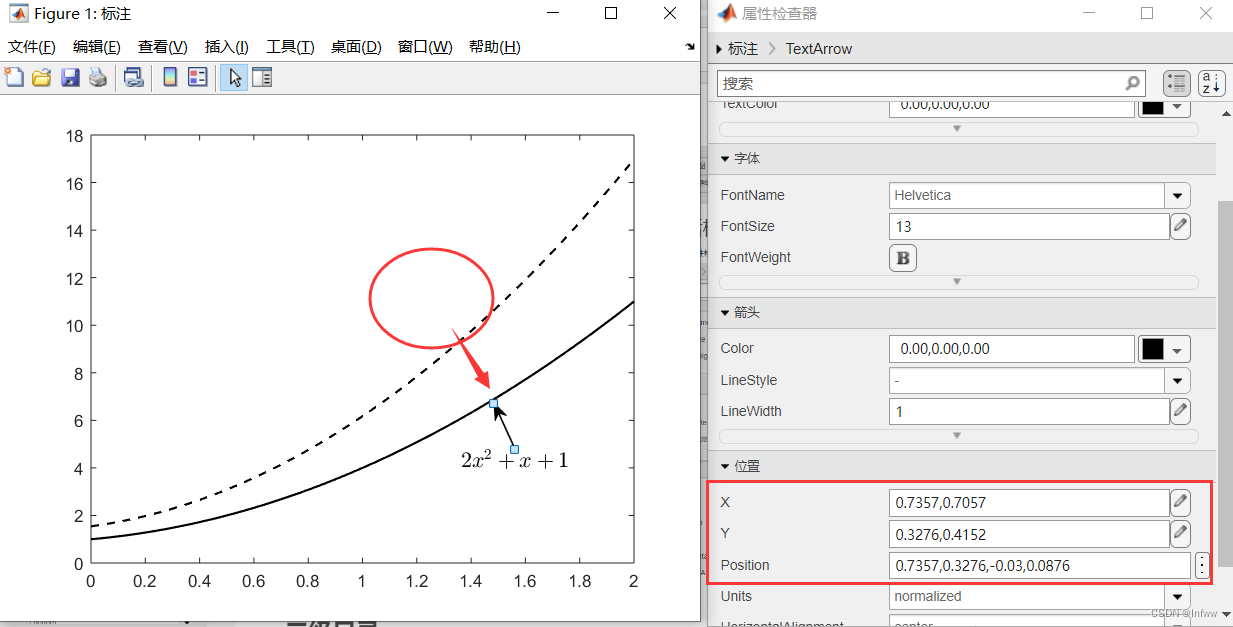
对应关系如下图。
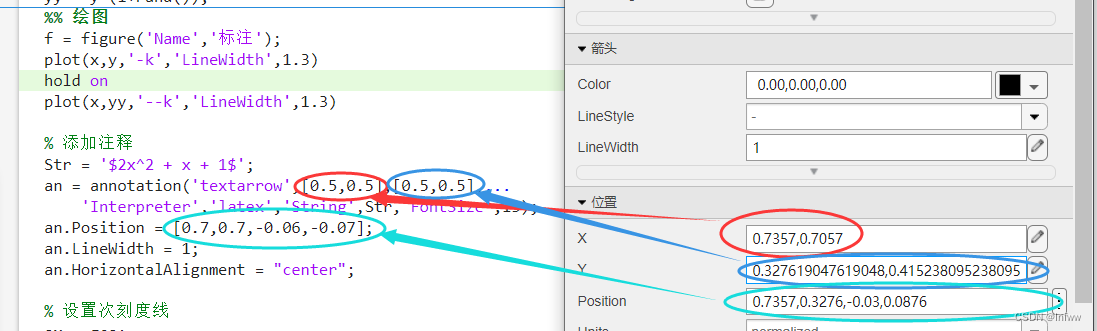
相应修改后的代码如下。
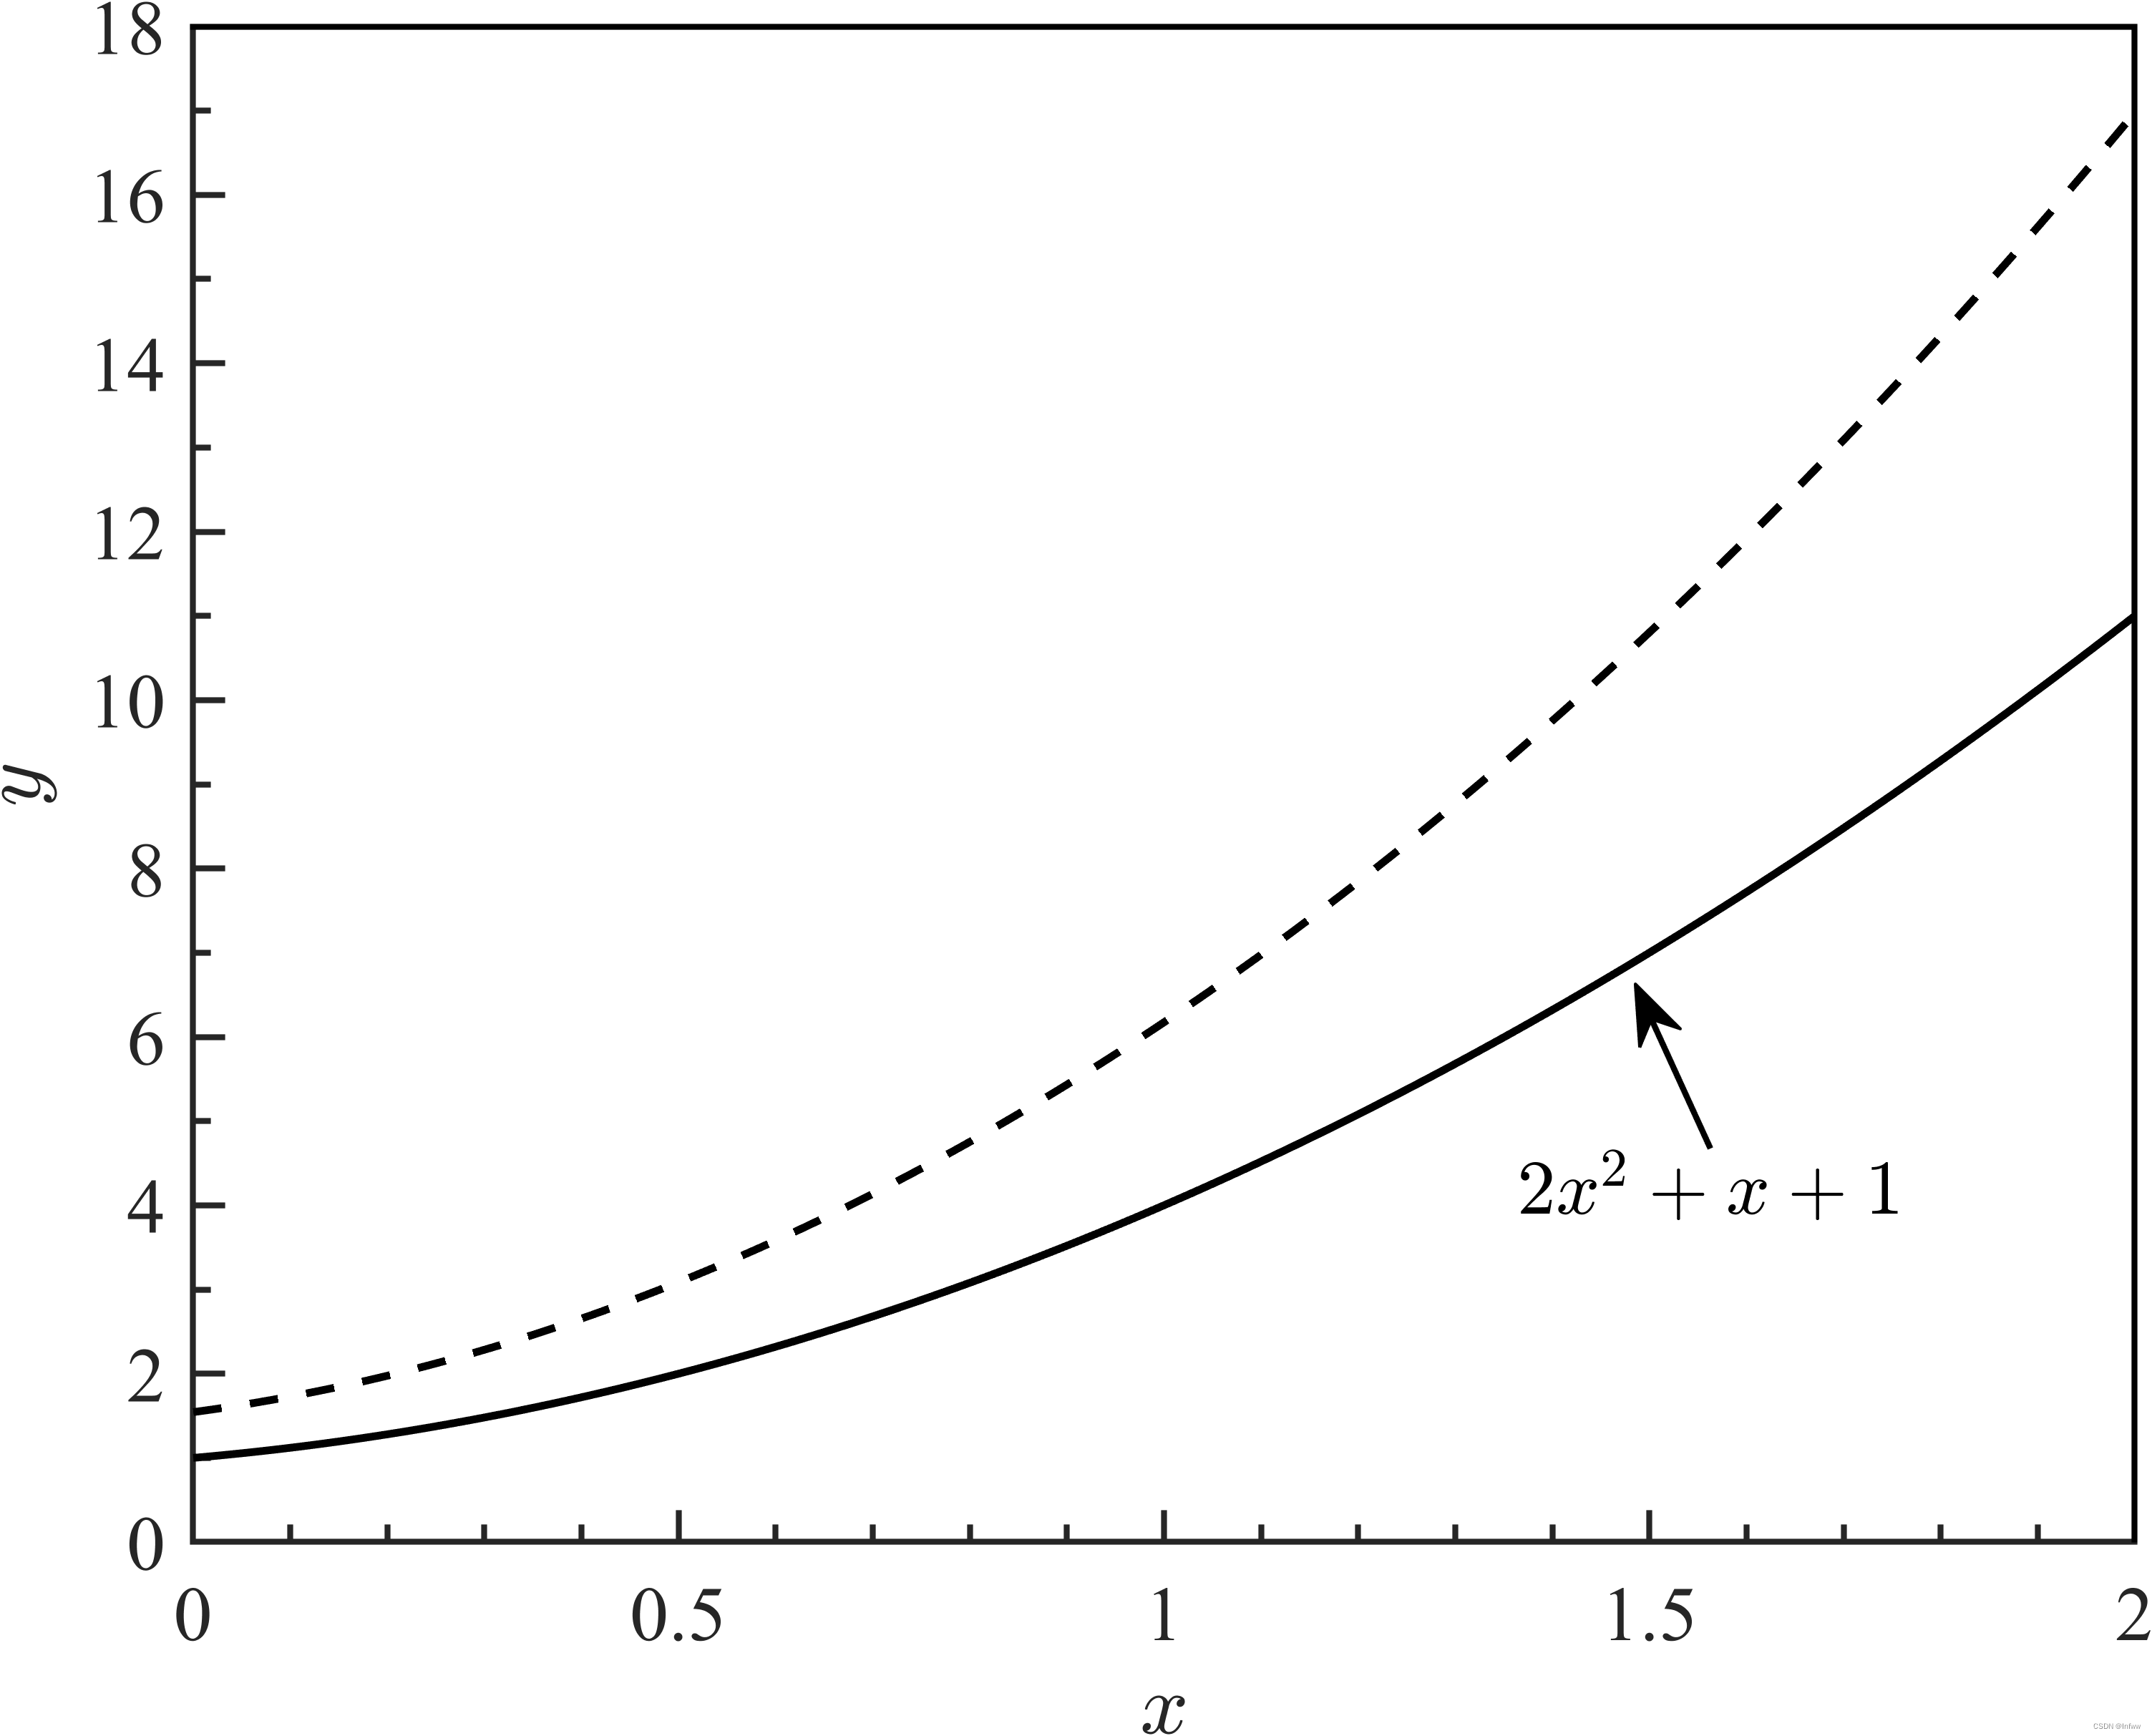
1 | Str = '$2x^2 + x + 1$'; |
再次运行,就可以得到相应位置的注释了。
6 细节调整
细节调整详细的解释可以看这篇文章,此外这里还额外设置了设置次刻度线范围(一个主刻度中次刻度线的数量)。
1 | % 设置次刻度线范围 |
若不设置,则为下面的左图,右图为设置后的样式。

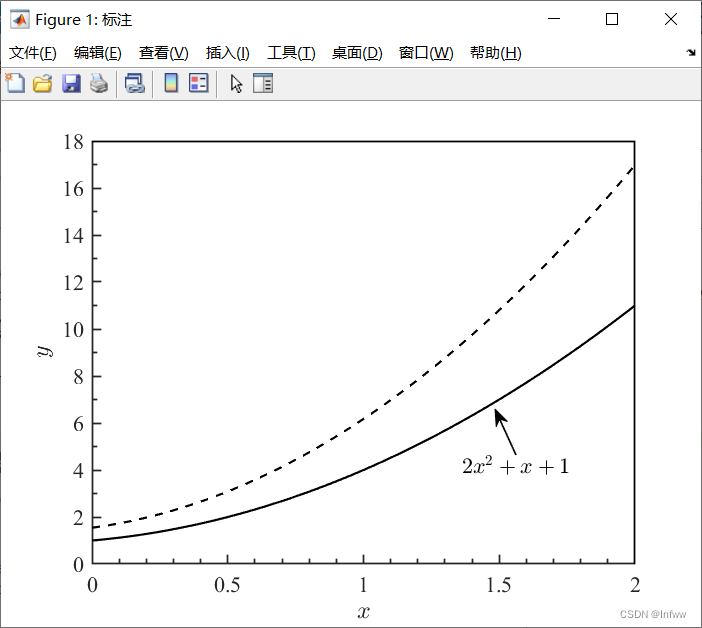
其他细节调整:
1 | % 设置x轴的属性 |
7 保存图片
1 | %% 保存图片 |
总代码
1 | clc;clear;close all |
本博客所有文章除特别声明外,均采用 CC BY-NC-SA 4.0 许可协议。转载请注明来自 KAZAMAのBlog!
 wechat
- alipay